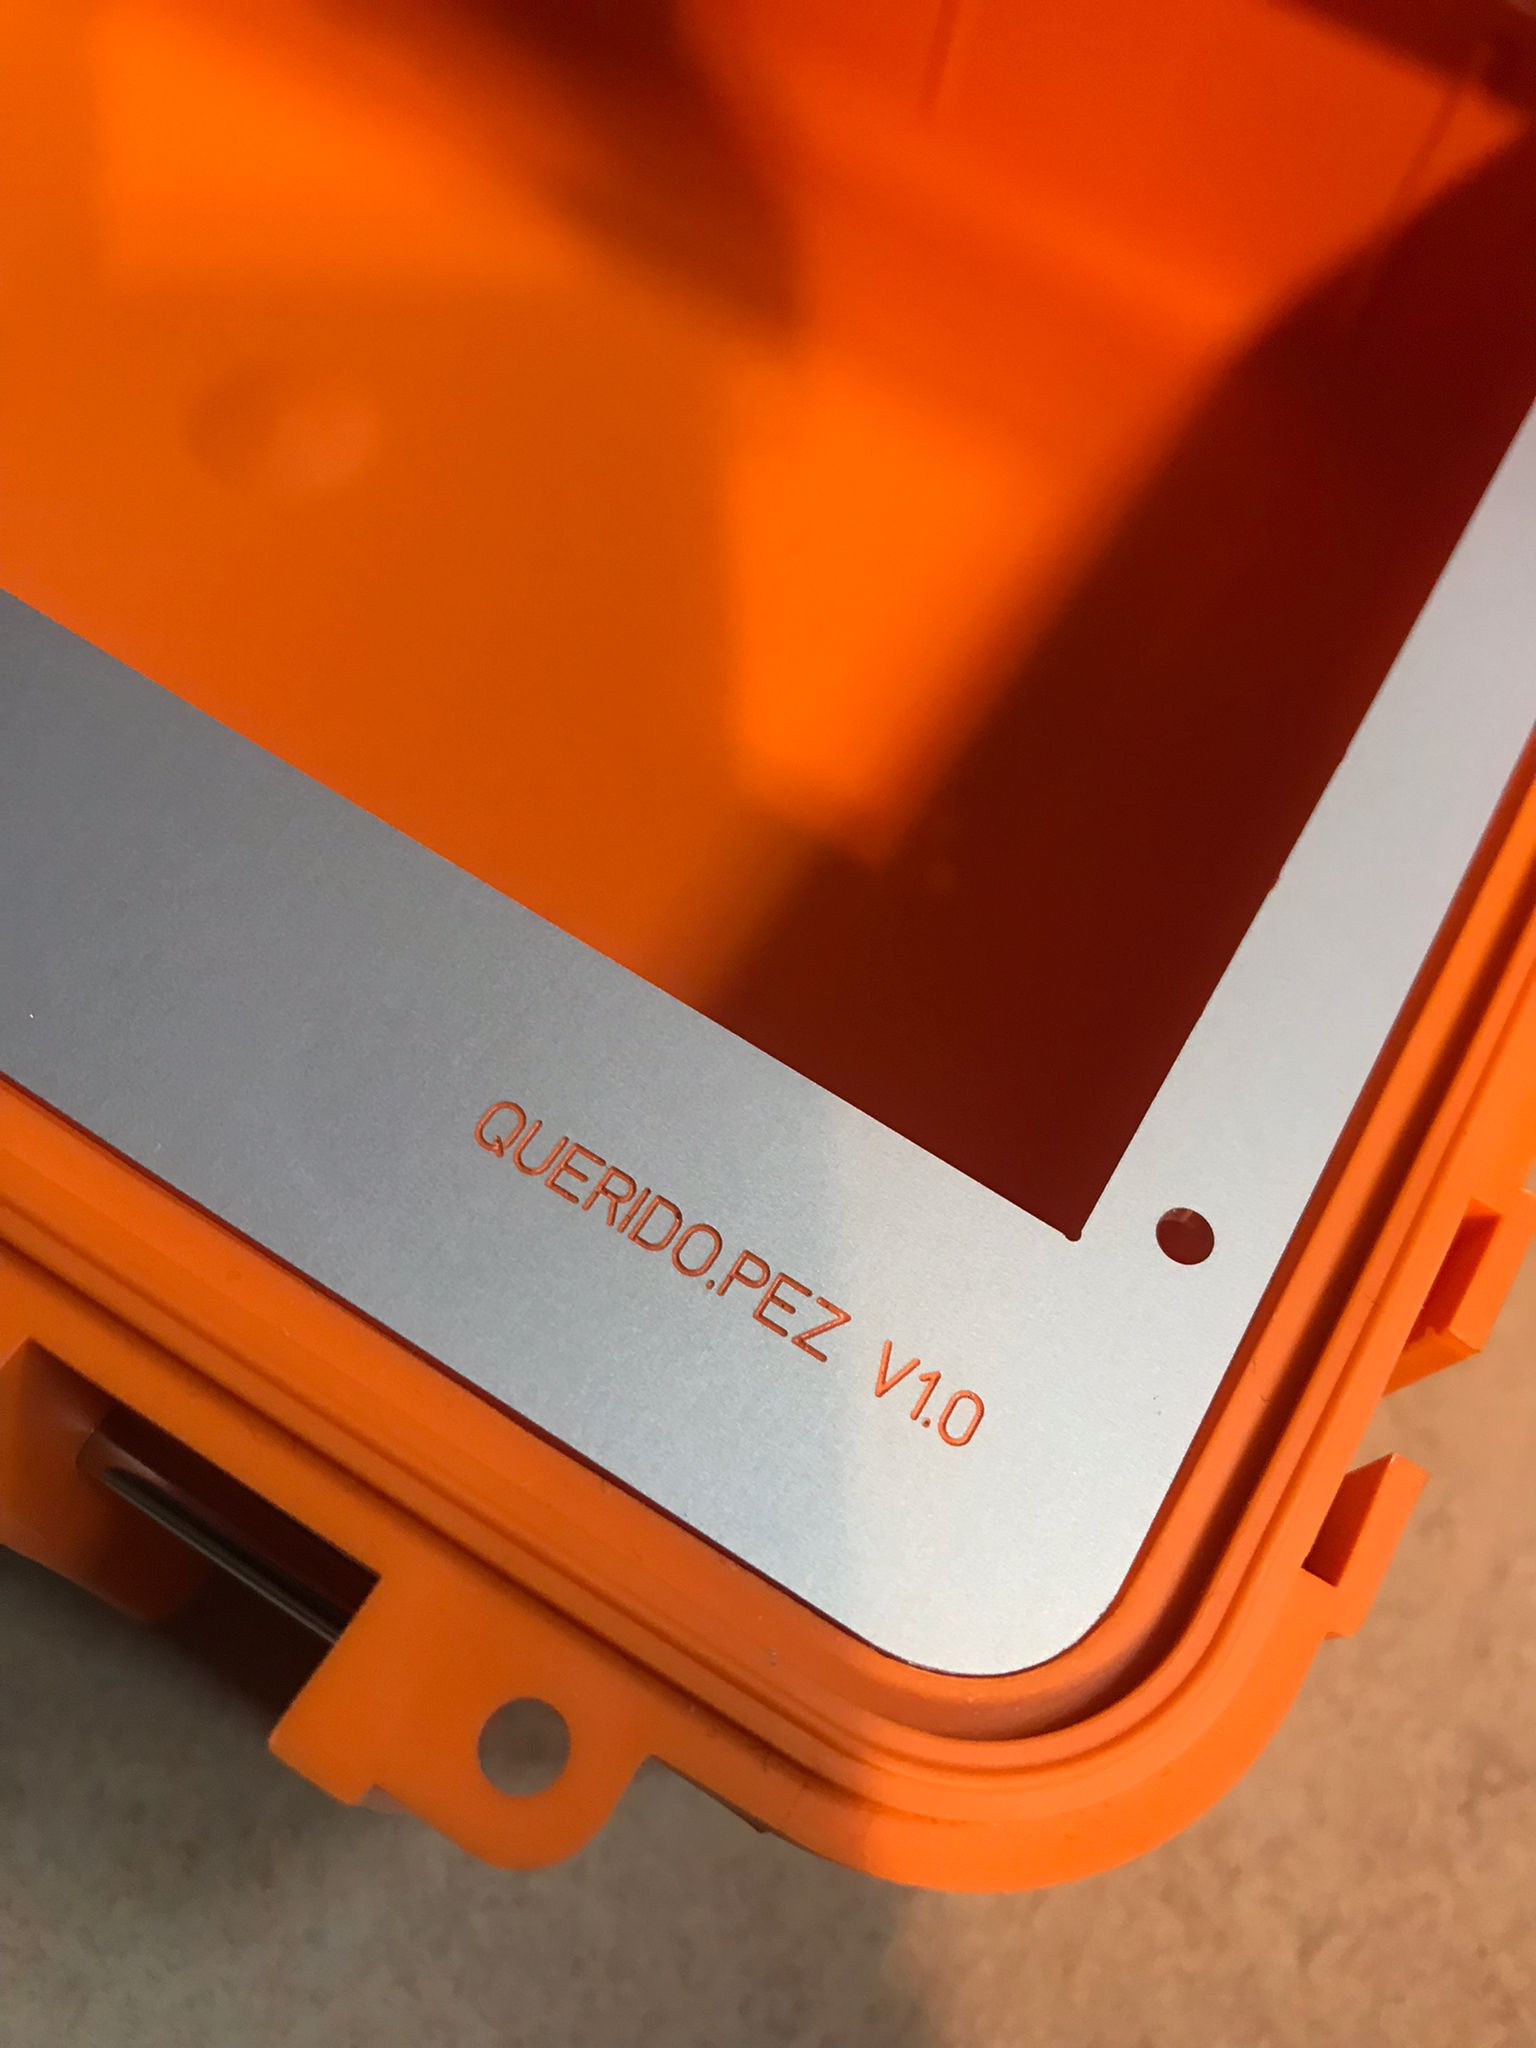
QUERIDO.PEZ II (RTK) (2022)
a water quality sensing and sonification device realized in the frame of the project Expeditions in Specific Territory Rostock-Montevideo
“The operation of the seaport is linked with emissions.”
opens the official page dedicated to Sustainability & Environment of Rostock Port.
1
Ports are characterized by several complex operations, when compared with other logistic nodes. Environmental pollution analysis of ports and Jetties are complicated due to the various types of contaminations, sources and their different characteristics. Pollution from port areas comes not only from ferries, ships and trade but also from industrial and shipyard activities as well as auxiliary services.
The Rostock Port it is located on the Unterwarnow estuary in the city of Rostock in a typical brackish water habitat. On the east bank of the Unterwarnow and on the south bank of the Breitling are the extensive facilities of the Rostock seaport, the chemical port for Yara to the east of it at Breitling, the independent cargo and fishing port (RFH) in Marienehe on the west side of the Lower Warnow, the cruise terminal at the passenger quay in Warnemünde, below it the shipyard facilities of the Neptun and Aker Warnow shipyards, and several former and active industrial facilities. South of the seaport the Rostock Power Station – a bituminous coal-fired combined heat and power plant – is situated. The port is connected to the PCK refinery in Schwedt and the chemical site in Böhlen in central Germany by pipelines.
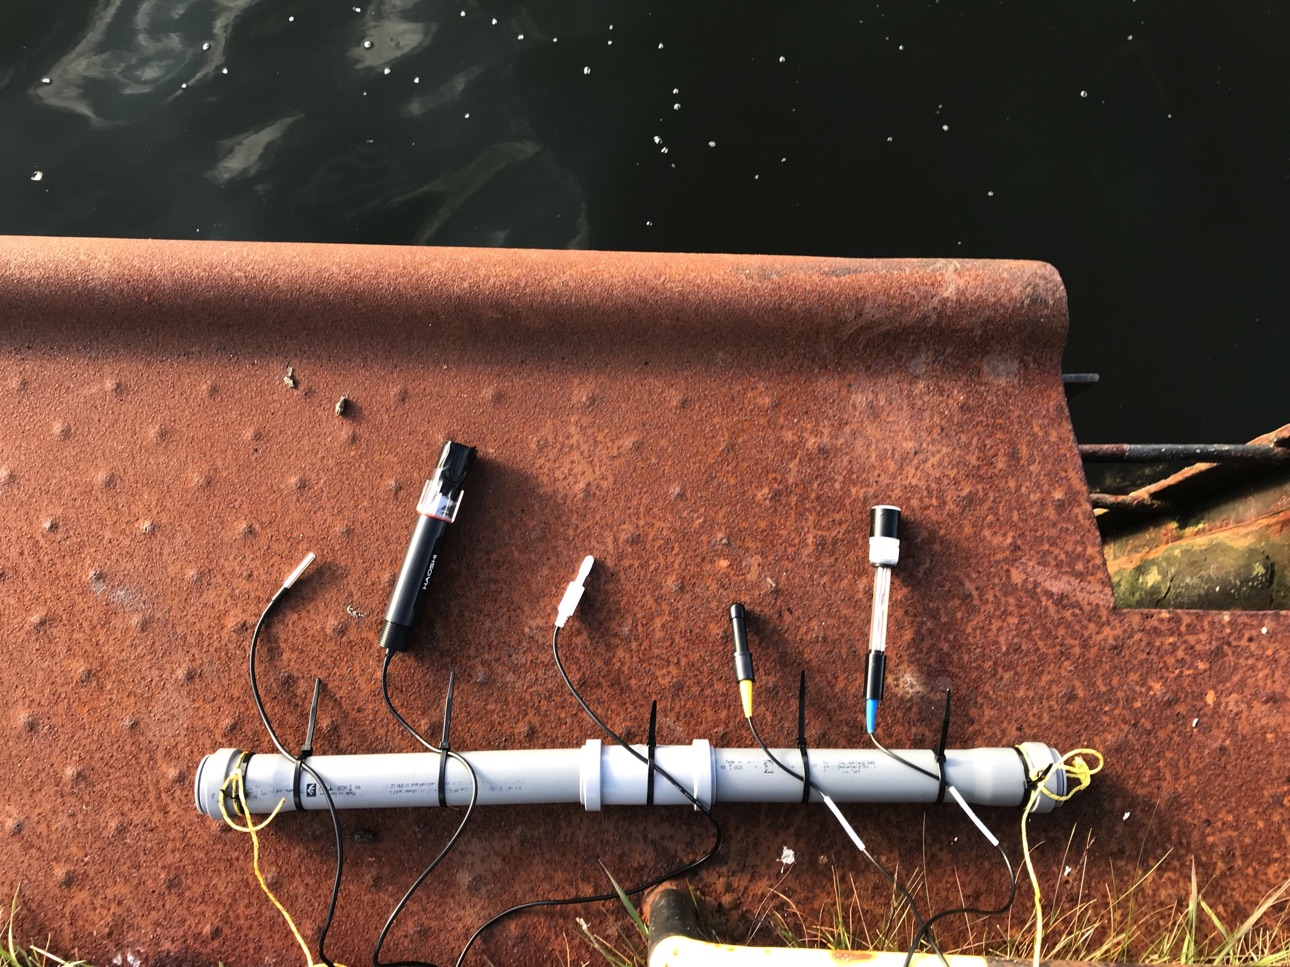
Still under the impression of our observations in the heavily polluted Montevideo bay the occupation with water has not let me go. From what was obvious in the Rio de la Plata estuary, i wanted to go a bit more in the details and was quite surprised that almost no critical literature about the water situation in and around Rostock was available not at all to compare with the sheer amount of studies about the Montevideo bay. So i had to focus on the collection of data and somehow to interface with the situation myself. Considering the short amount of time available i decided for a data sonification approach and developed a modular and lightweight sensor field-kit.
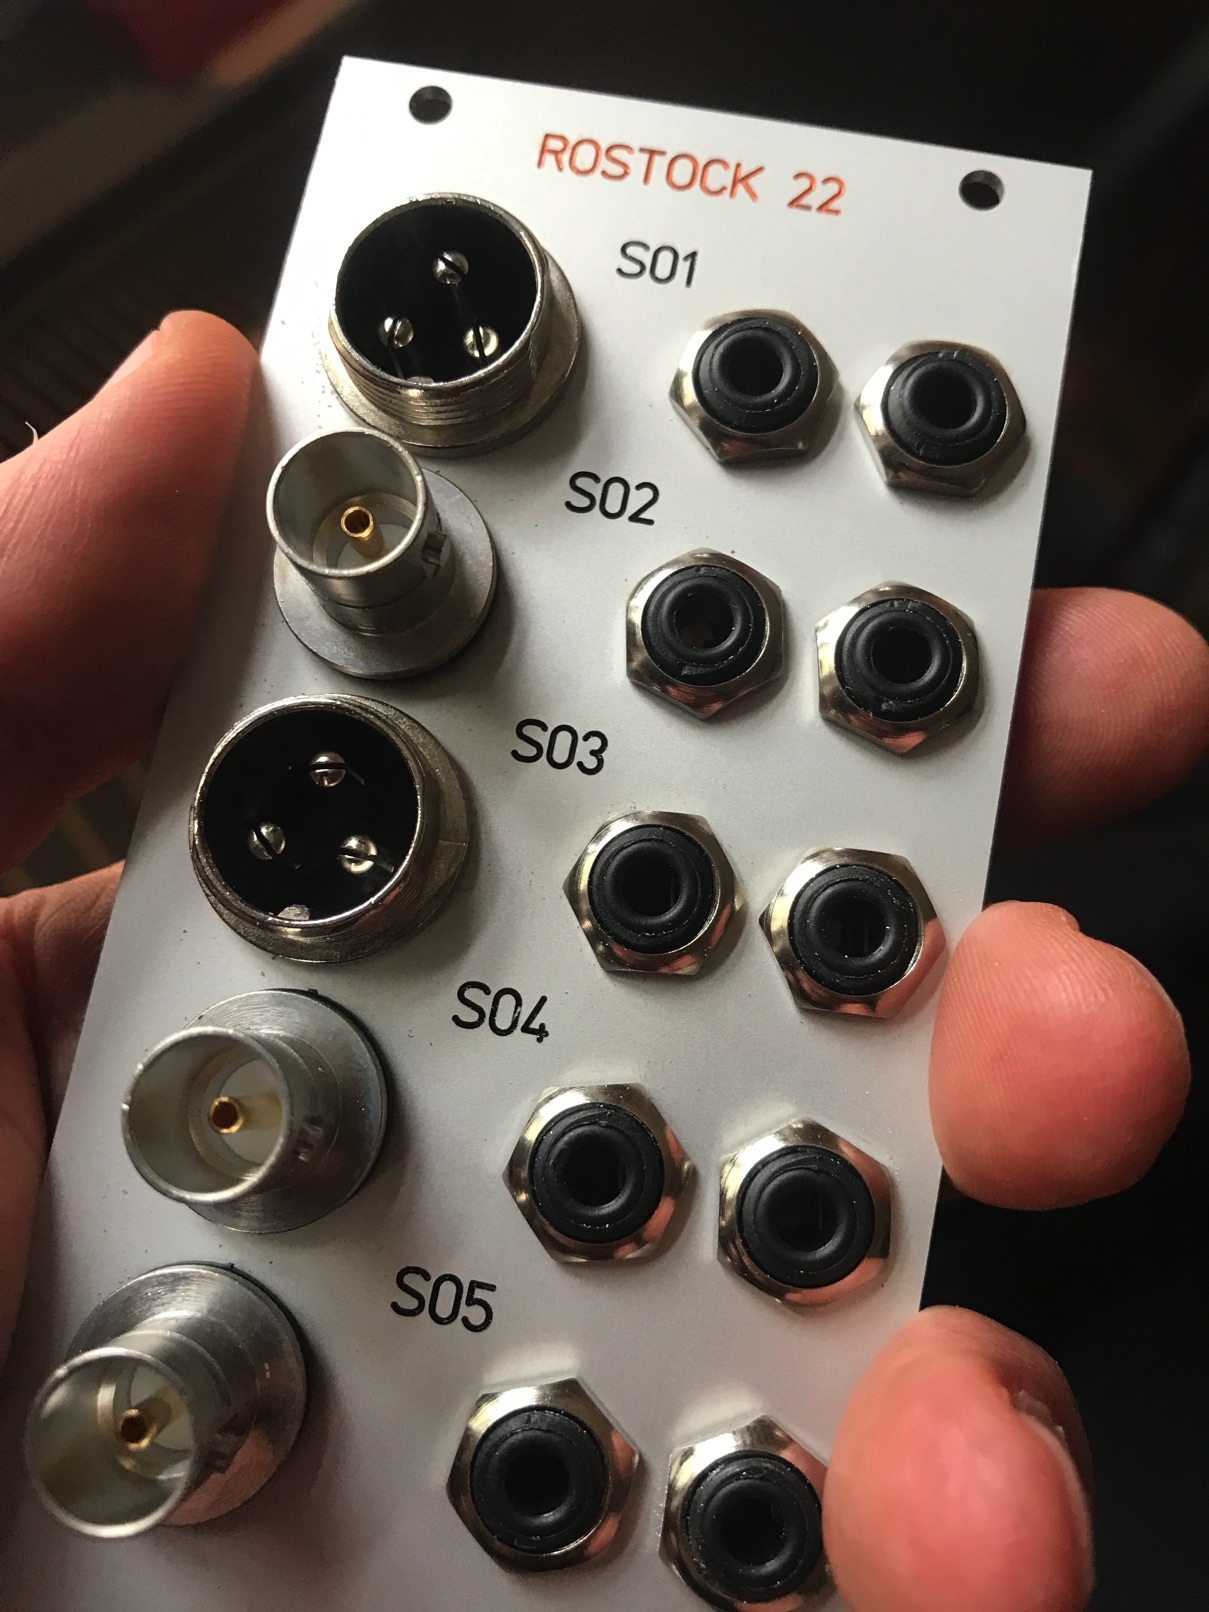
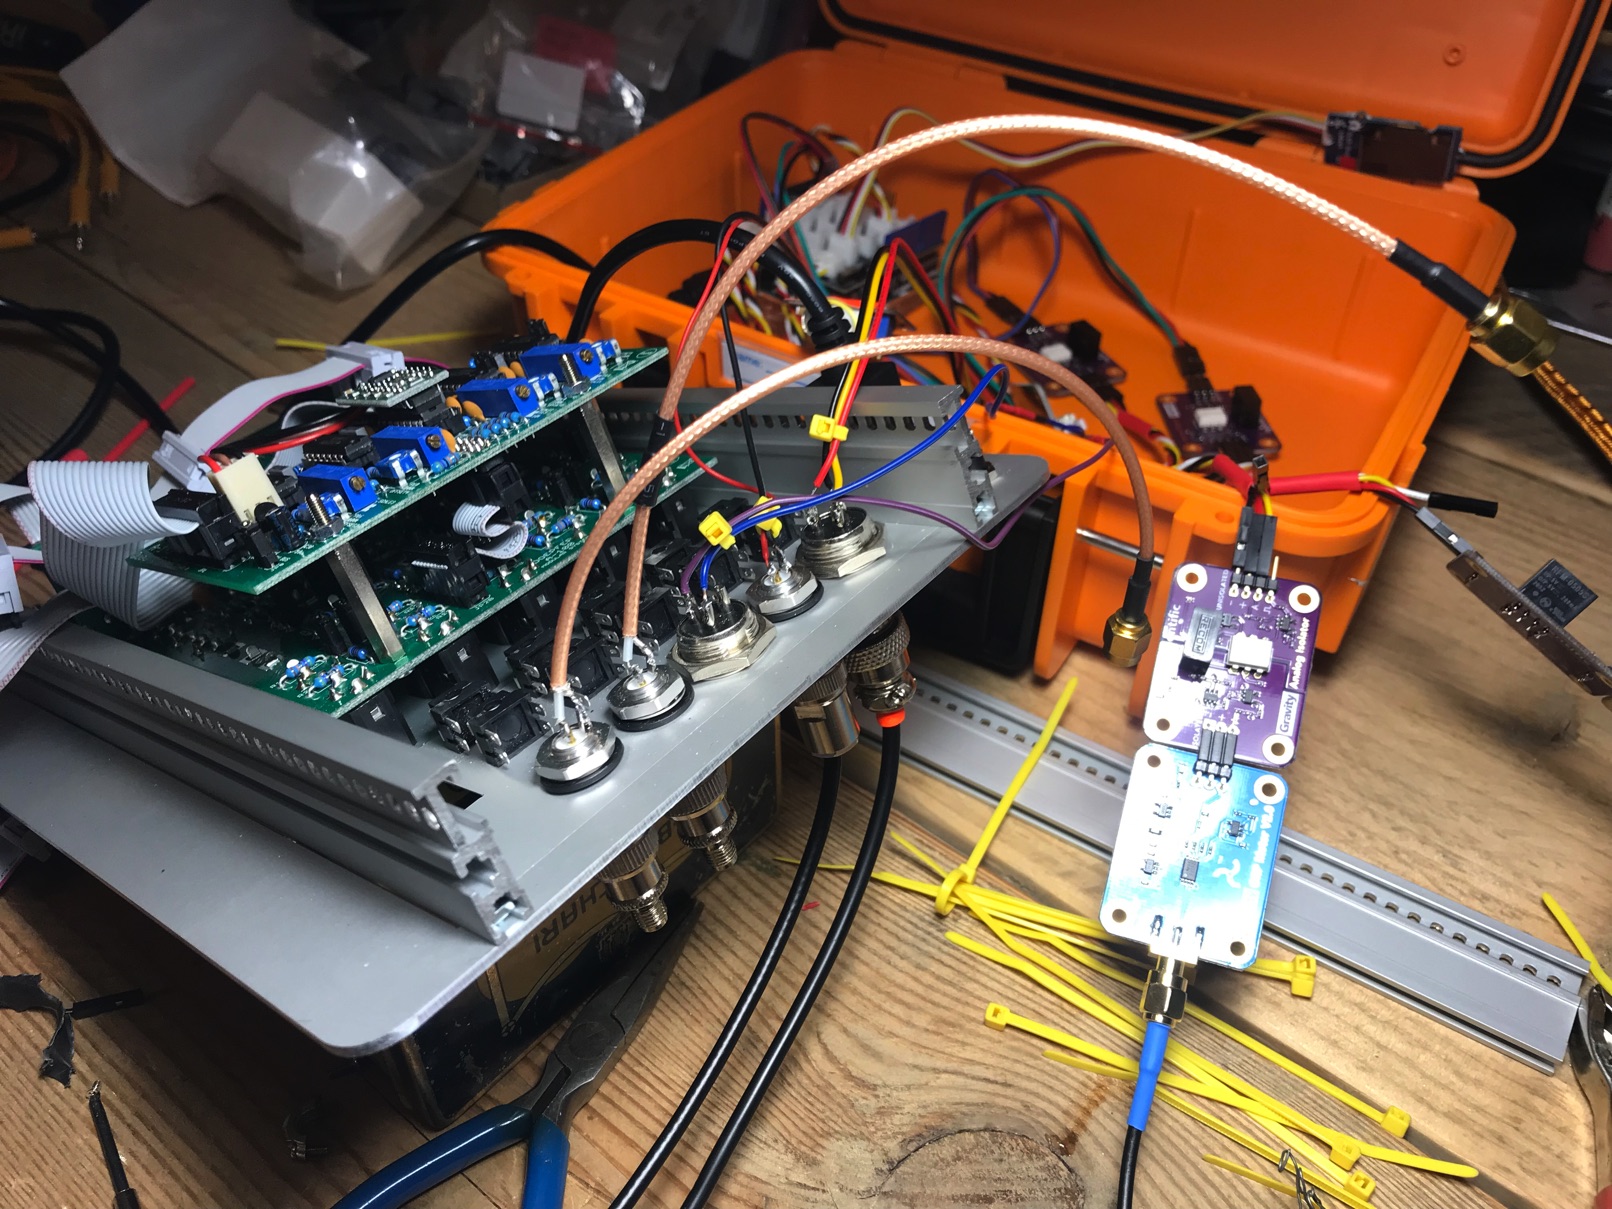
Saddling on the Eurorack standard for tone generation and filtering a sensor-input/CV-output module was developed on Arduino base (thanks for the great help to
jo-frgmnt-grys
!)
2.
The module can monitor 5 basic water quality parameters –
pH-value
,
Total Dissolved Solids
(TDS),
Dissolved oxygen
(DO),
Oxidation-Reduction Potential
(ORP) and
temperature
. The CV outputs can be patched to any VCLFO/VCO or filter.
The water parameters/sensors
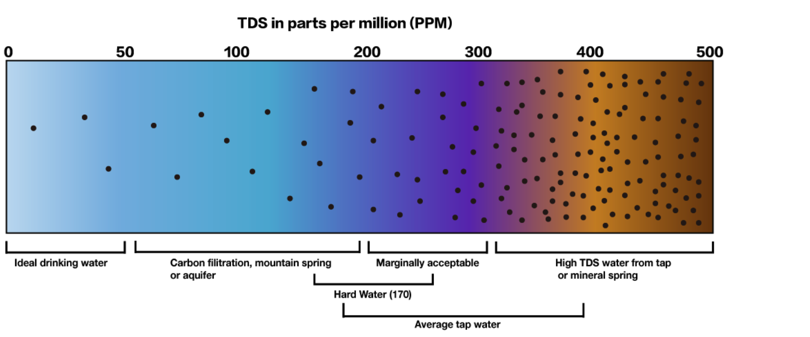
TDS – Total Dissolved Solids
is a measure of the dissolved combined content of all inorganic and organic substances present in a liquid in molecular, ionized, or micro-granular suspended form. TDS concentrations are reported in parts per million (ppm). In general, the higher the TDS value, the more soluble solids are dissolved in water, and the less clean the water is. Therefore, the TDS value can be used as one reference point for reflecting the cleanliness of the water.
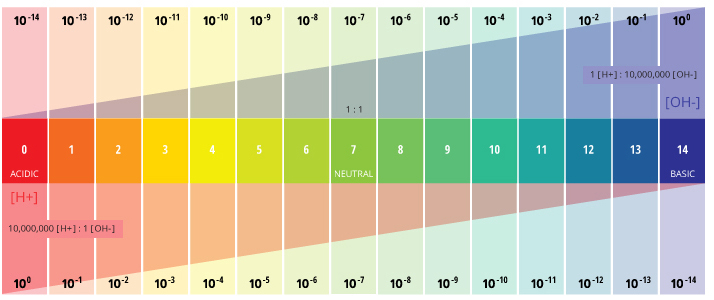
pH
– power of Hydrogen
The ocean absorbs about 30% of the carbon dioxide (CO2) that is released in the atmosphere. When CO2 is absorbed by seawater, a series of chemical reactions occur resulting in the increased concentration of hydrogen ions. This process has far reaching implications for the ocean and the creatures that live there.
In the 200-plus years since the industrial revolution began, the concentration of carbon dioxide (CO2) in the atmosphere has increased due to human actions. During this time, the pH of surface ocean waters has fallen by 0.1 pH units. This might not sound like much, but the pH scale is logarithmic, so this change represents approximately a 30 percent increase in acidity.
If the pH of water is too high or too low, the aquatic organisms living within it will die. pH can also affect the solubility and toxicity of chemicals and heavy metals in the water. The majority of aquatic creatures prefer a pH range of 6.5-9.0, though some can live in water with pH levels outside of this range.
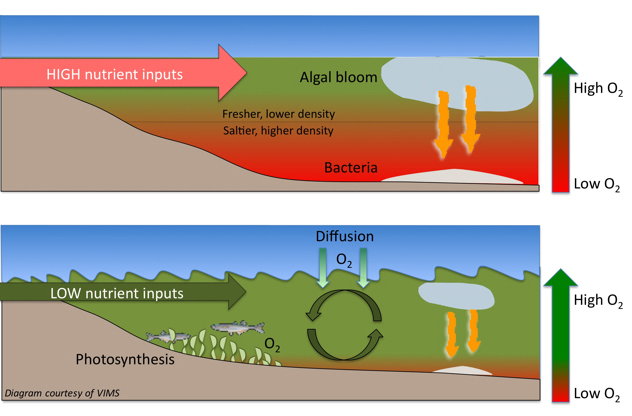
DO – Dissolved Oxygen
it’s one of the foremost important parameters when assessing water quality due to its influence on the organisms living within a body of water. The amount of oxygen in water, to a degree, shows its overall health. That is, if oxygen levels are high, one can presume that pollution levels in the water are low. Conversely, if oxygen levels are low, one can presume there is a high oxygen demand and that the body of water is not of optimal health.
Dissolved oxygen refers to the level of free, non-compound oxygen present in water or any other liquids. The non-compound oxygen, or free oxygen (O2), is oxygen that’s not bonded to any other element.
Dissolved oxygen enters the water through the air or as a plant byproduct of photosynthesis. From the air, oxygen can slowly diffuse across the water’s surface from the surrounding atmosphere, or be mixed in quickly through aeration. Dissolved oxygen is also produced as a waste product of photosynthesis from phytoplankton, algae, seaweed, and other aquatic plants.
In brackish (mixed water) habitats with nutrient inputs from agriculture the problem of Hypoxia (low oxygen) can create so called “dead zones” of unbalanced aquatic environment. (See the important Over-fertilization (eutrophication) research of Maren Voß for the Baltic region
3
)
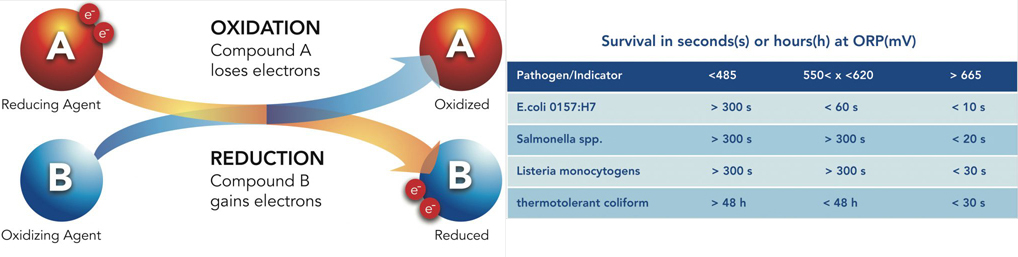
ORP – Oxidation-Reduction Potential
is a measure of the ability of oxidation and reduction of an aqueous solution, which the relative degree of oxidizing or reducing. The unit is mV. If the oxidation-reduction potential is high, then chemical oxidation is strong. But if the potential is low, then oxidation is weaker. The positive potential indicates that the solution shows a certain degree of oxidation: while the negative potential means that solution shows a certain degree of reduction.
Oxidation-reduction potential (ORP) can be used to detect water contamination with the benefit of a single-value measure of the disinfection potential, showing the activity of the disinfectant rather than the applied dose. For example, E. coli, Salmonella, Listeria, and other pathogens have survival times of under 30 seconds when the ORP is above 665 mV, compared against 300 seconds when it is below 485 mV.
Of course all these factors and many others are interrelated and form a fragile balance…
(For further reading on water parameters i recommend the website of Fondriest – Environmental Learning Center
4
)
Sonification approach
A range of sonification methods has been tested and implemented to access and understand data. These methods aim to exploit what we know about human perception of sound. Different categories of sonification can be identified:
1) The data can be mapped onto clearly recognisable perceptual parameters, such as pitch, loudness and duration. The user can focus on the evolution of a particular parameter in order to gain an aural analogue of the data.
2) The data can be mapped onto sound variables so that the overall timbre of the sound represents the evolution of the data. Timbre is a complex sound phenomenon, different from parameters such as pitch. Many parameters and variables of a synthesis algorithm contribute to the composition of timbre.
3) When wishing to portray many channels of data, one can create a mix of separately perceivable sounds. For example assigning left-right panning values or different synthesised timbres to the different channels can improve their perception.
4) Many channels of data can contribute to the evolution in time of a single sound with a complex timbre.
5) In some cases one channel of data can be mapped onto more than one sound variable (possibly improving the perception of that data channel by utilising parameter redundancy). 5
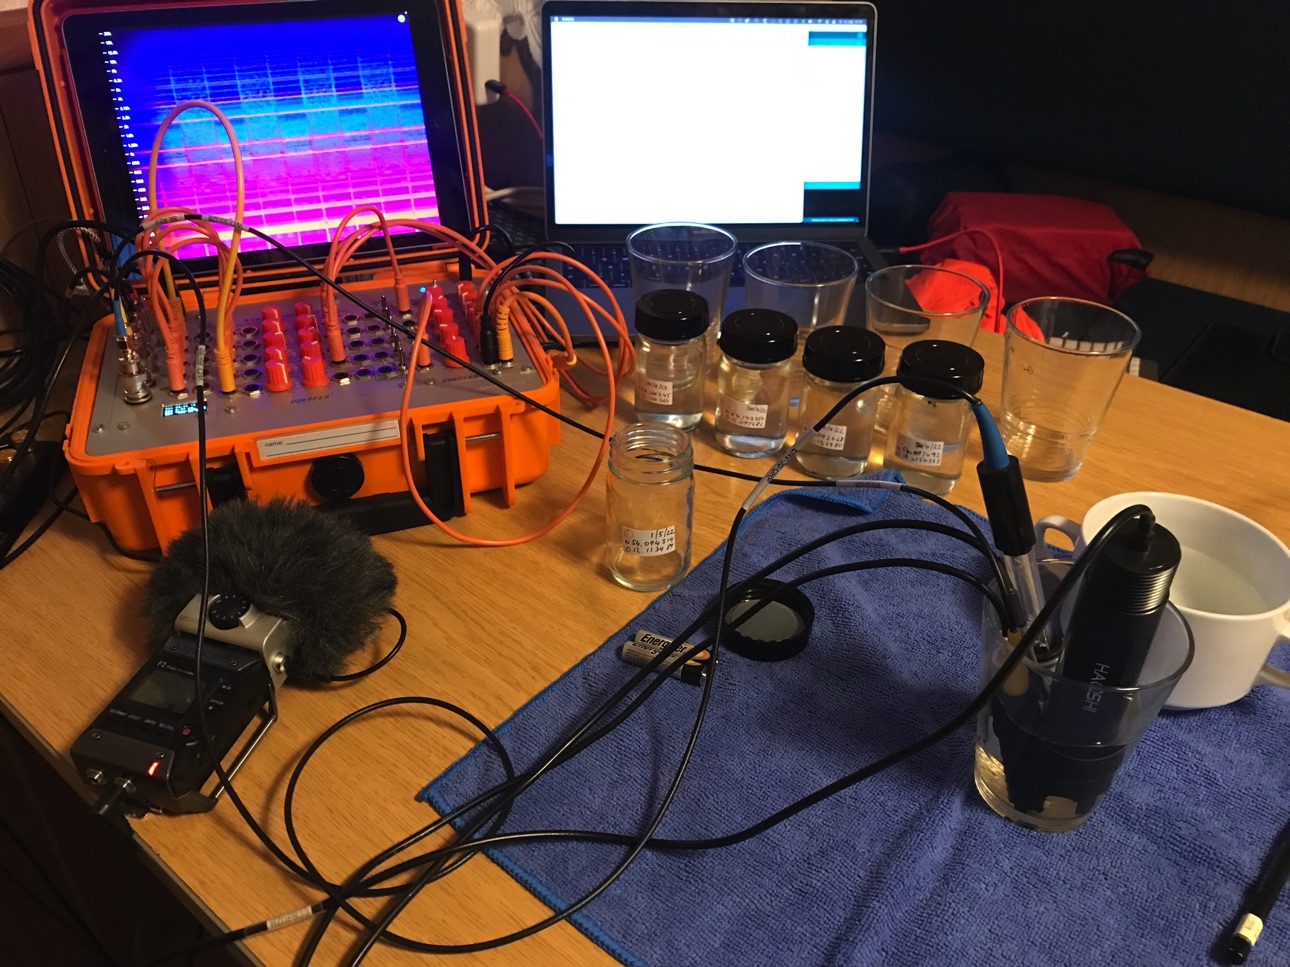
Usually complex sets of data or measurements over a large time span are sonified in order to open up another understanding. – My initial idea was to compare data of different locations around the Rostock Port area.
As all parameters of the synthesizer are manual adjustable and very delicate, this comparison only makes sense on the base of collected samples, which would be sonified under the same lab conditions with one particular synthesizer setting. I conducted and recorded test series of probes from 10 different locations around the Unterwarnow and Breitling. Of course these measurements are just approximated values, the quality and calibration of the sensors is not certified lab-standard but served well to set the different probes in relation to each other. (I’ll post the results here shortly)
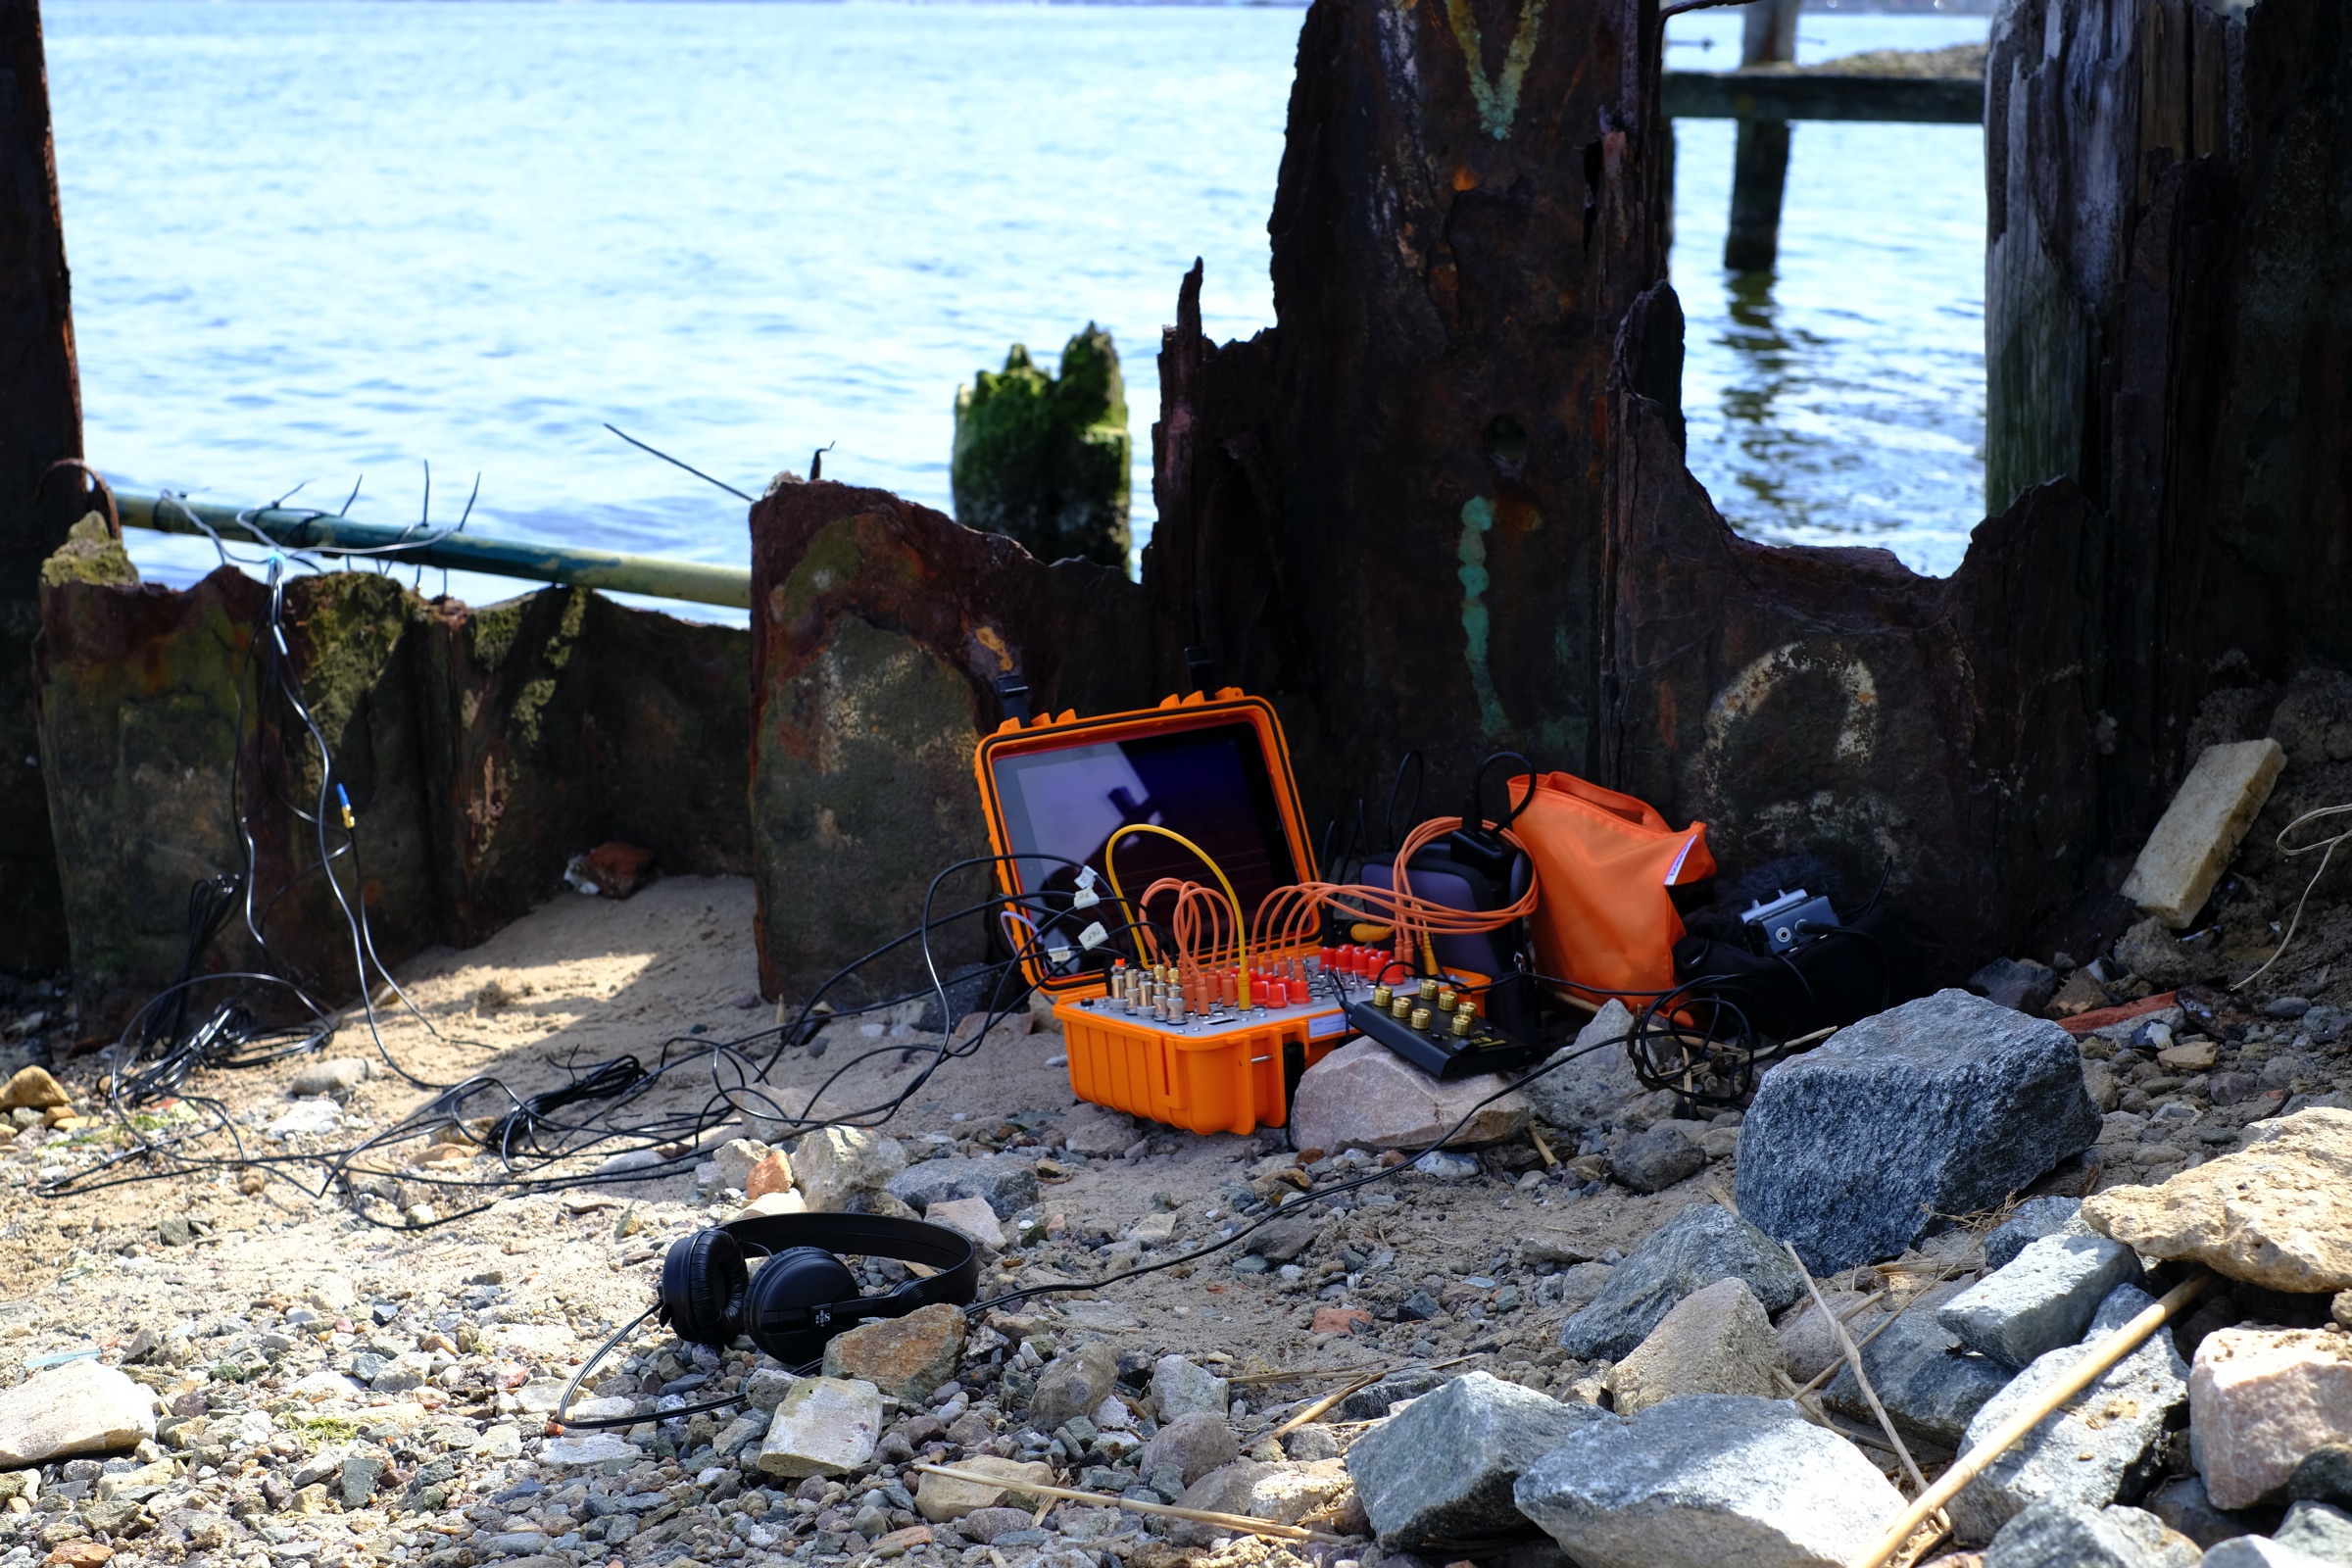
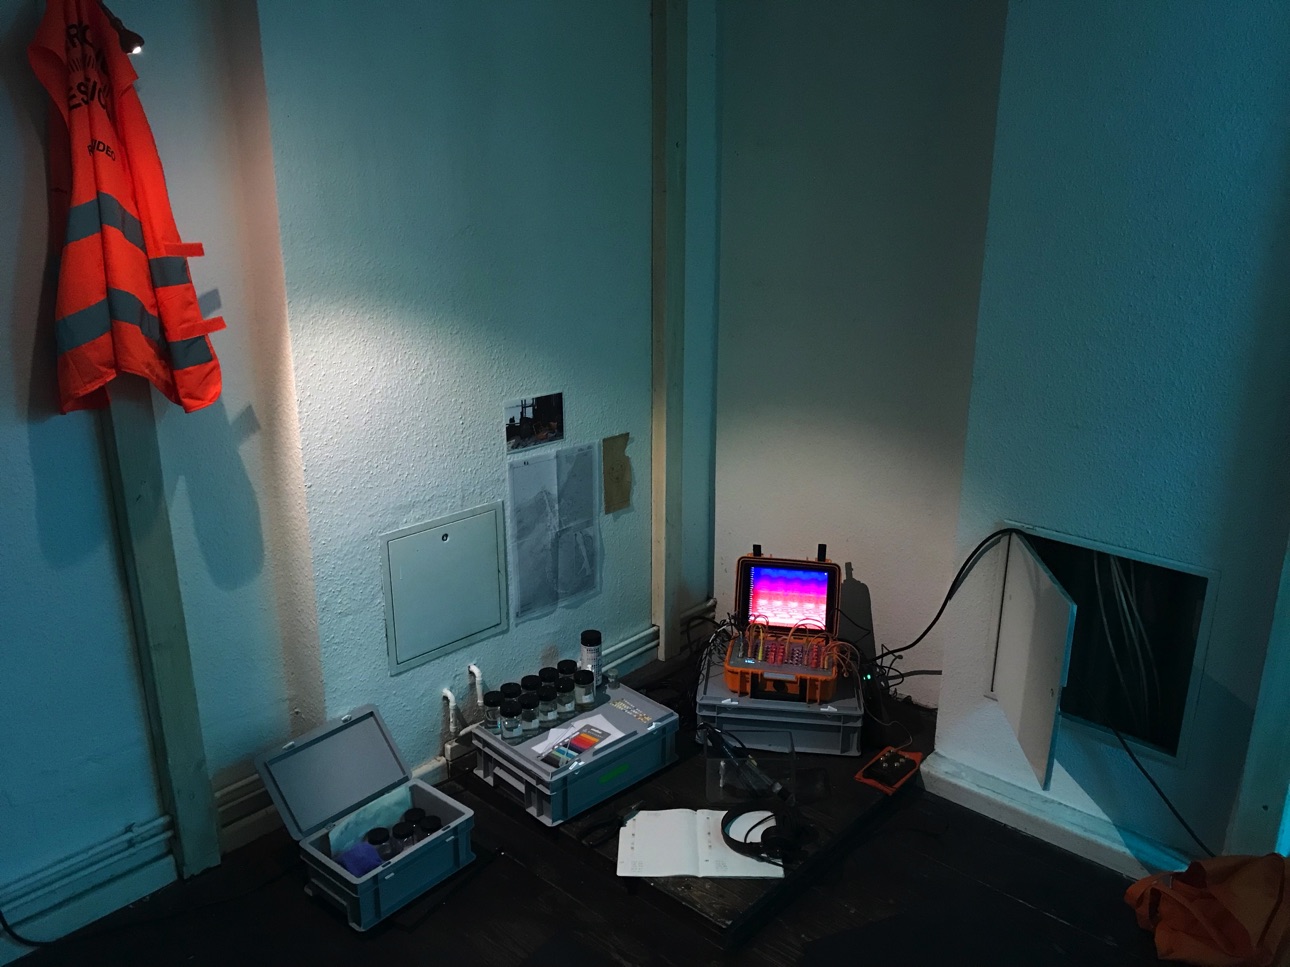
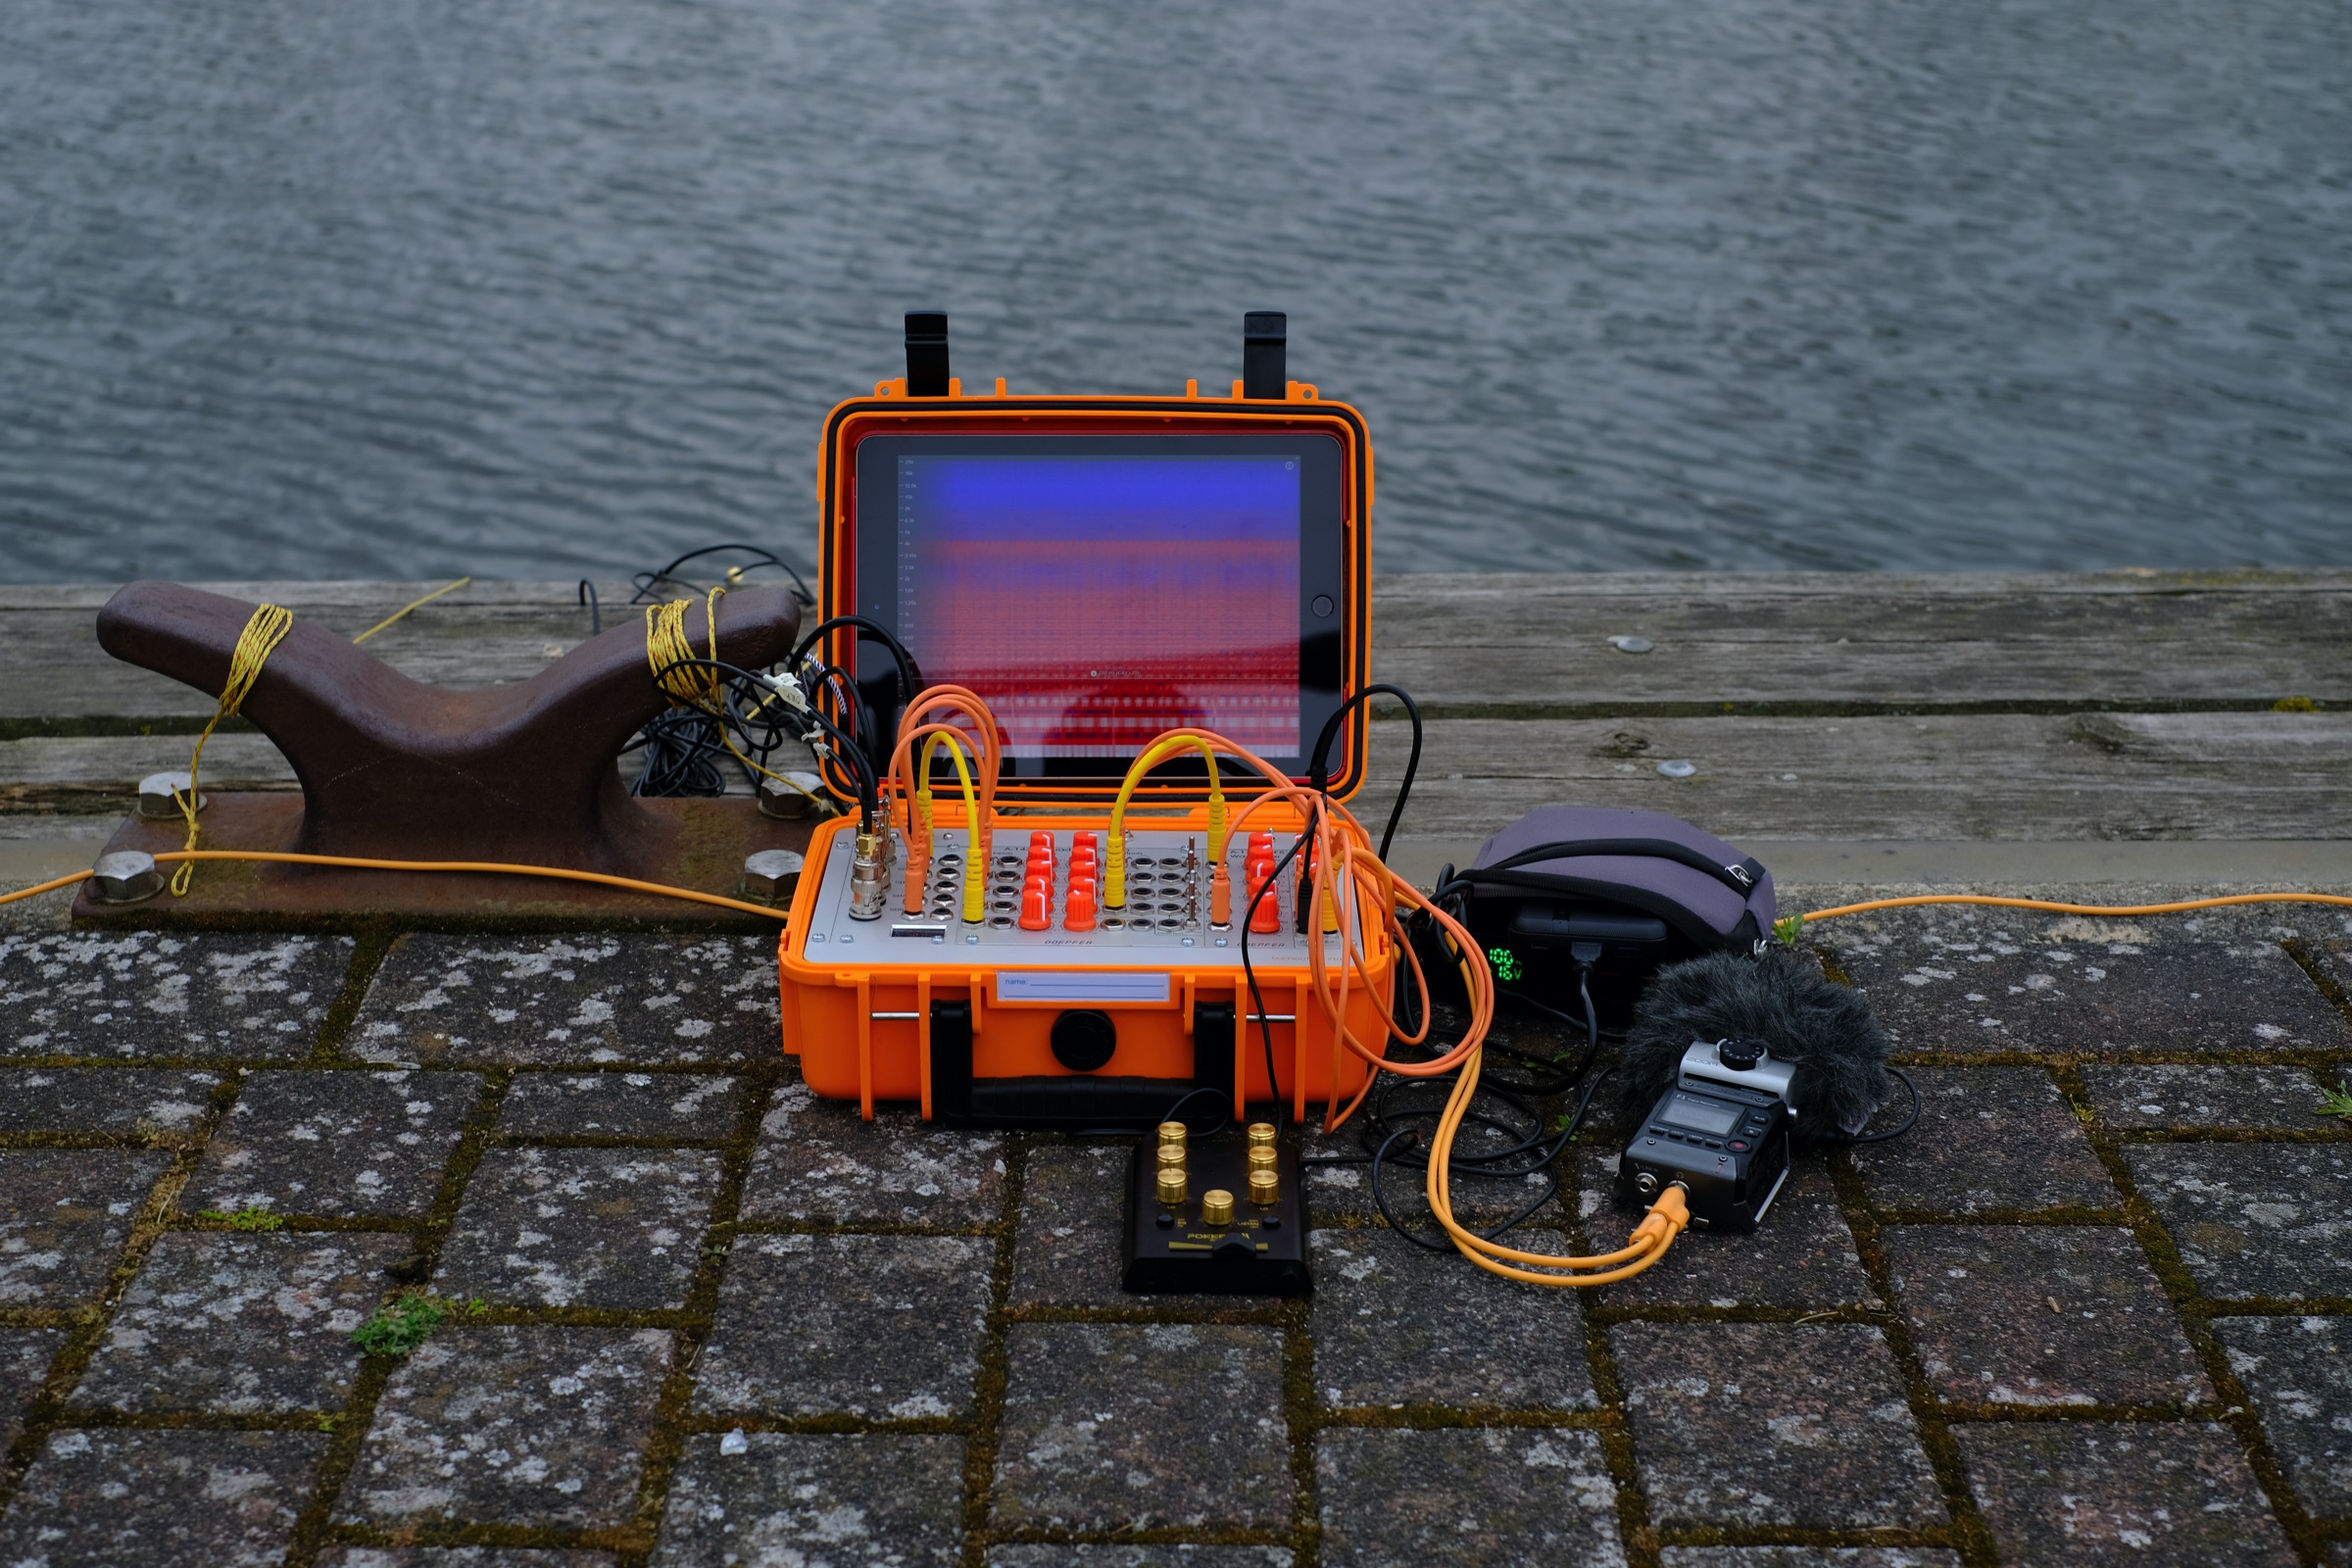
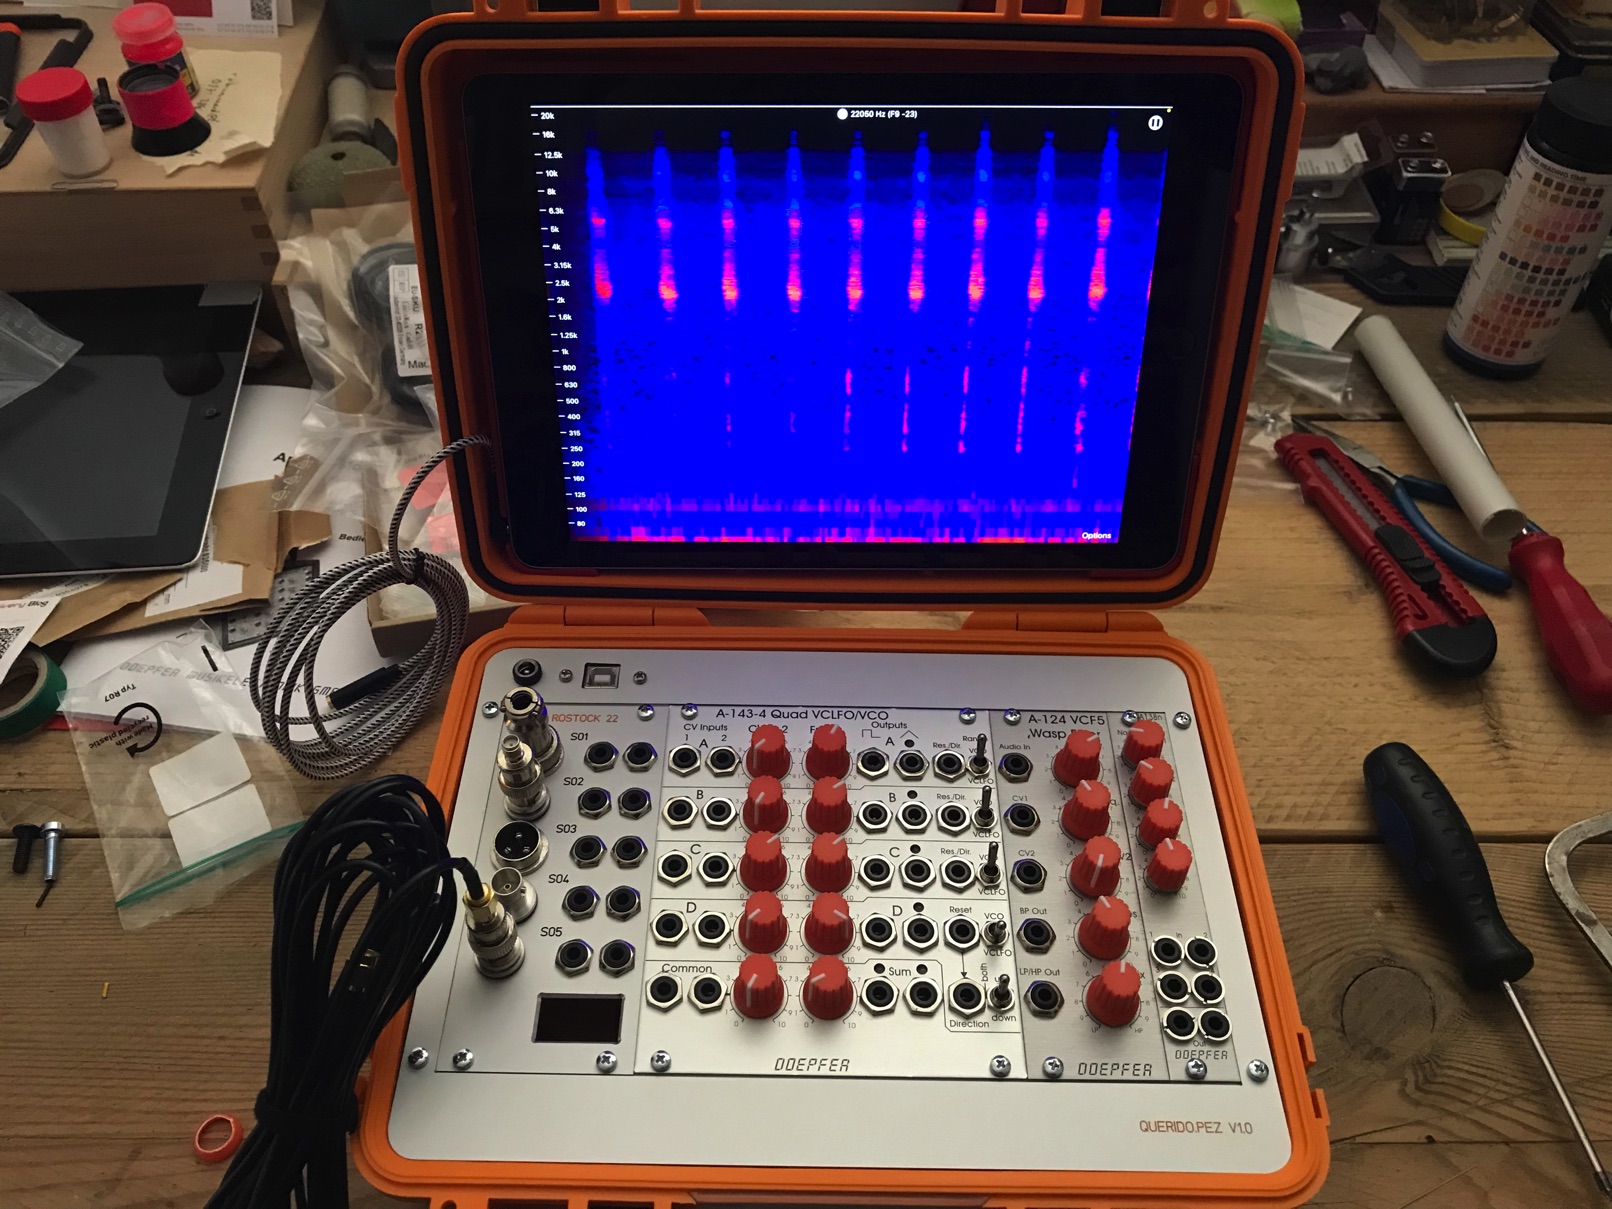
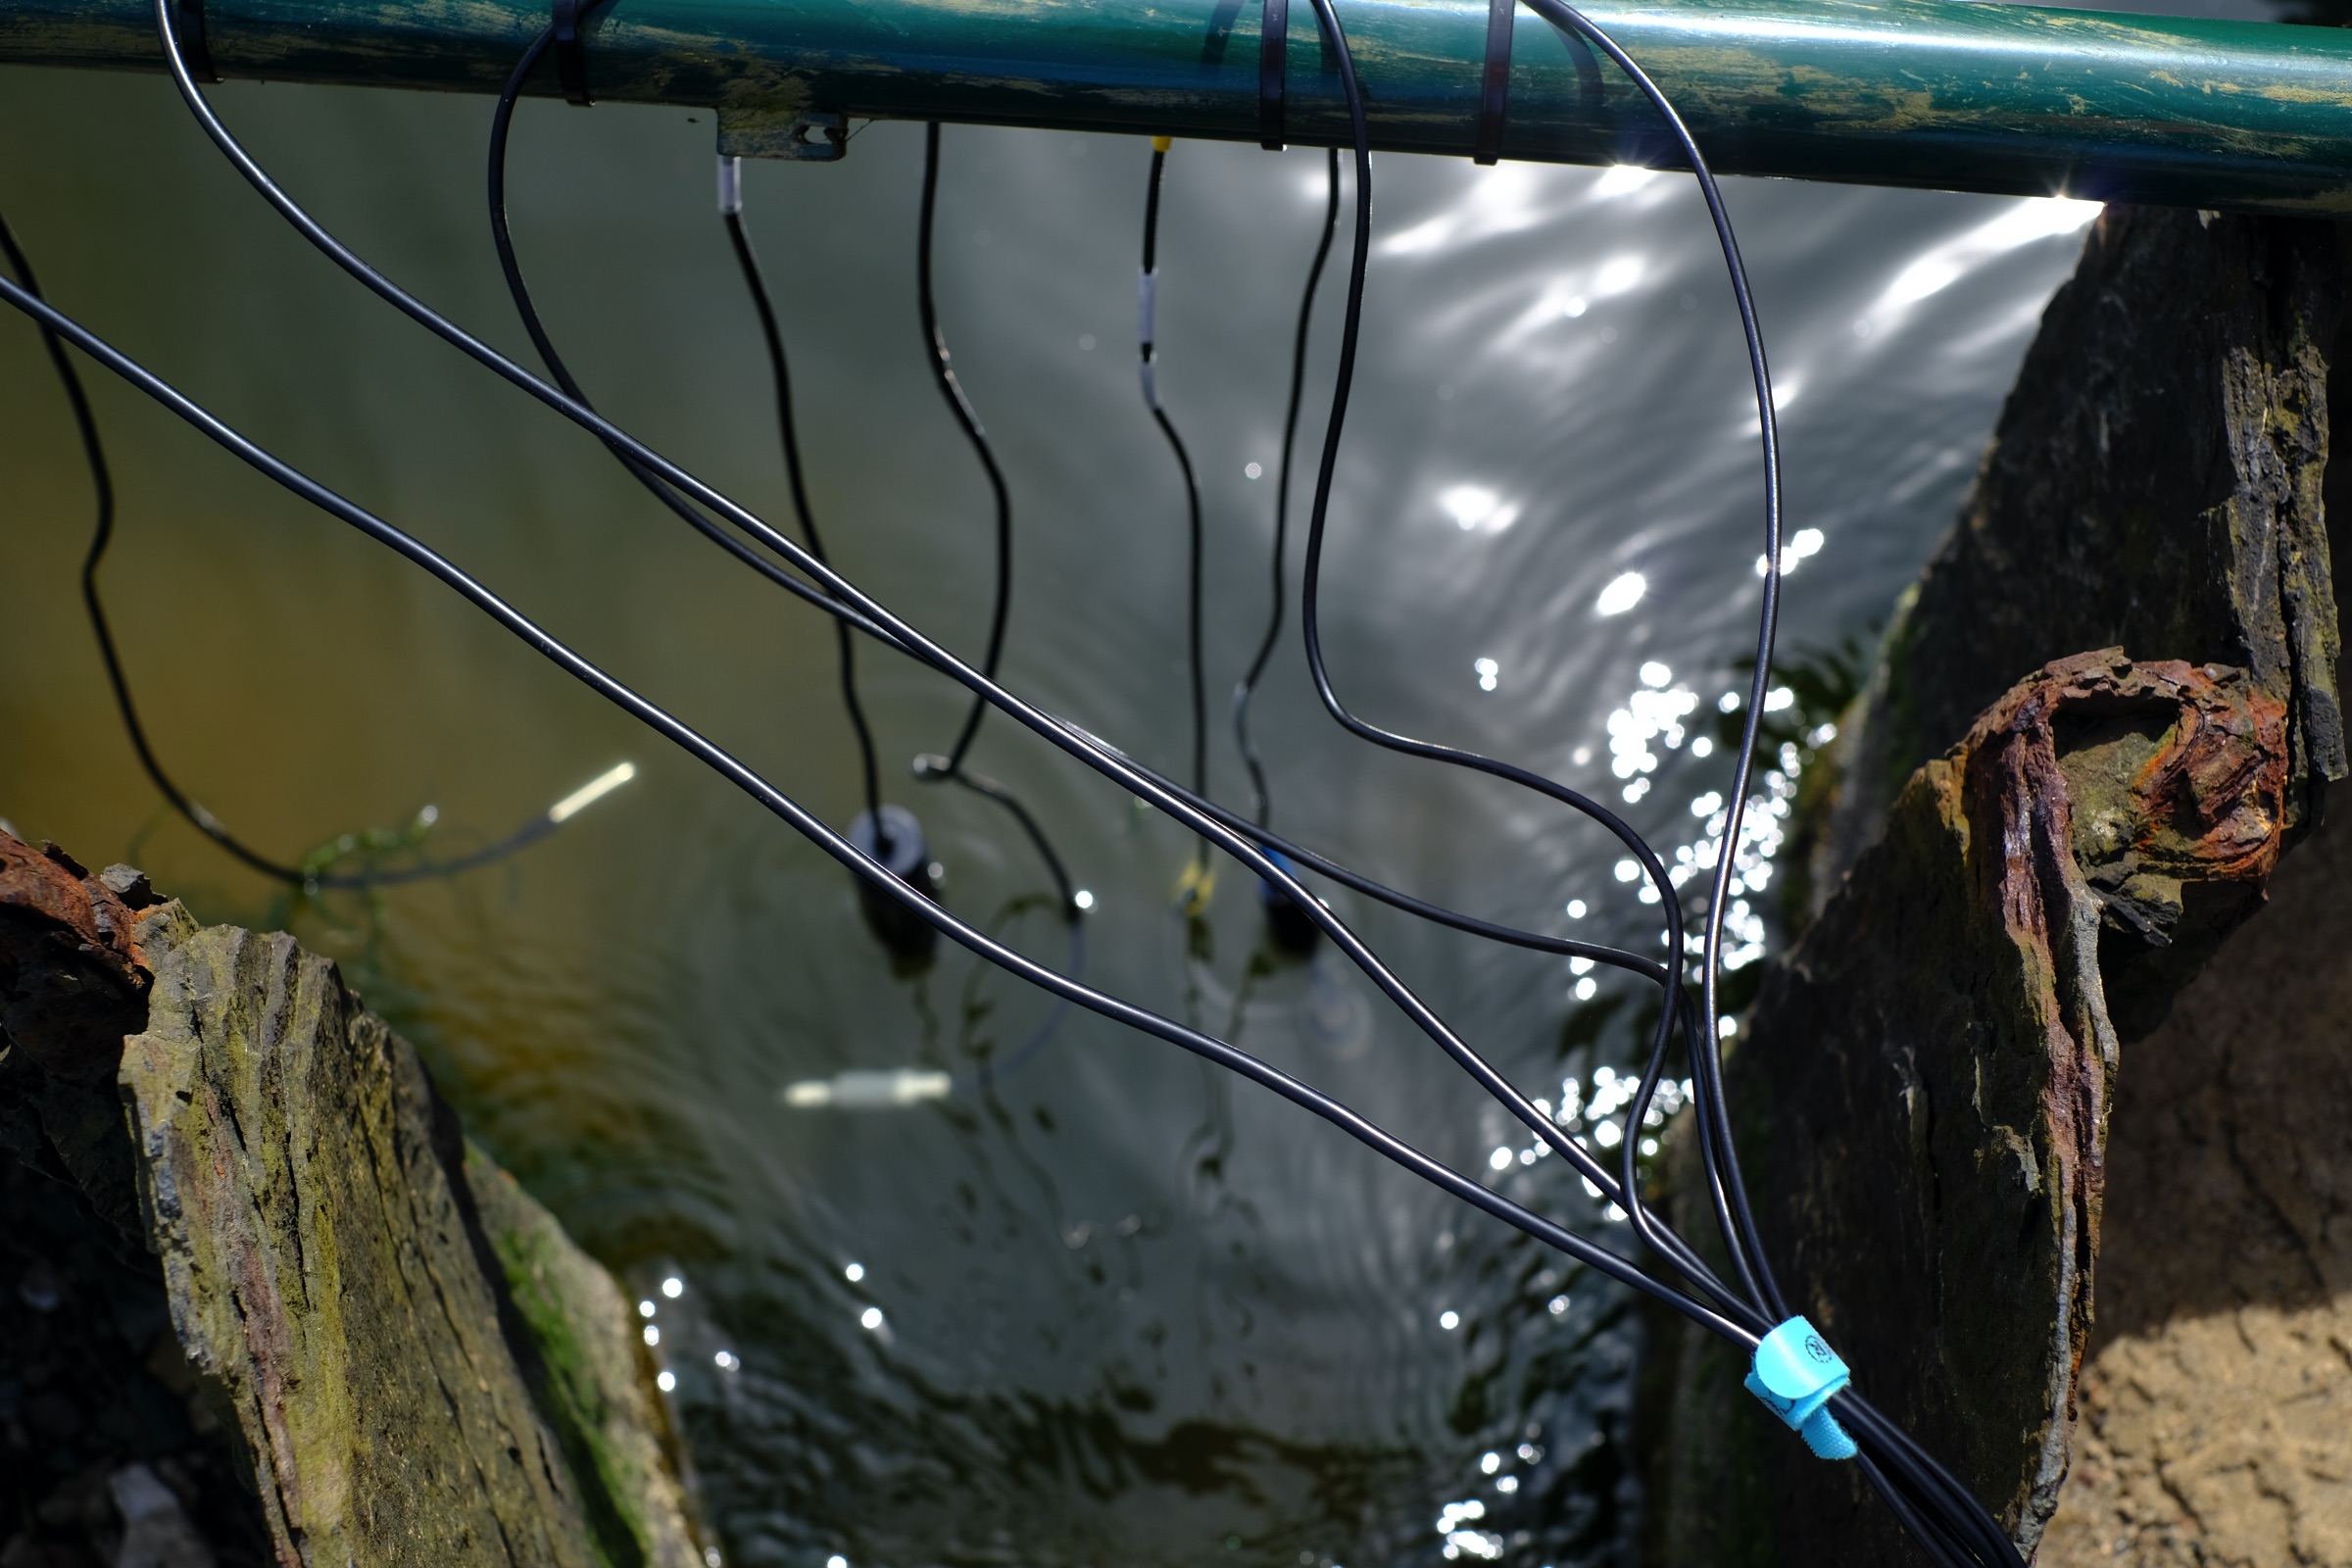
Apart from the test series, the device functioned well as field kit. Data readings from the sensors turned out less static as expected, so that a basic tuning provided interesting installative in-situ diffusions and furthermore served as an interface to get in contact with an accidental audience. (recordings from two set-up situations below)
Screen capture from the spectrogram analysis:
(re)sources:
1
Sustainability – Nature and Environmental Protection
Rostock Port
2
jo-frgmnt-grys
software/development support
3
Maren Voß
Her research on the importance of nitrogen in marine cycles is recognized with the Björn Carlson Baltic Sea Prize 2022.
4
Water Quality Parameters
Fondriest – Environmental Learning Center
5
A Toolkit for Interactive Sonification
Sandra Pauletto & Andy Hunt
further reading:
Unknown substance discovered in the Baltic Sea
Berliner-Zeitung, June 9, 2022
Urban population exposure to NOx emissions from local shipping in three Baltic Sea harbour cities – a generic approach
Martin Otto Paul Ramacher1, Matthias Karl, Johannes Bieser, Jukka-Pekka Jalkanen, and Lasse Johansson
Neue Herausforderungen – Der Umgang mit erhöhten Schadstoffgehalten im Rostocker Baggergut
Ricarda Neumann
Moorzerstörung für Hafenausbau Rostock unverantwortlich und aus der Zeit gefallen!
BUND, Naturschutz, Naturschutz
Anpassung der seewärtigen Zufahrt zum Seehafen Rostock
Untersuchungen des Phyto- und Zooplanktons sowie der physikalisch-chemischen Messgrößen zur Ermittlung der Gewässergüte
Dr. Claus-Dieter Dürselen, Birgit Heyden, Heike Simon, Thomas Raabe